Train with real accounting work
Learners work through realistic close, reporting, payroll, AP, AR, revenue, GL, and inventory scenarios.
Controller Lab for Teams
Develop accounting and finance skills through hands-on work. See what your team has demonstrated—and where they’re ready to grow.
The manager view
A clearer view of what your team can do. Ratings are grounded in completed graded work; filter by industry, study area, department, or cohort—without confusing activity with capability.
Employer dashboard
Demonstrated capability, program progress, and learning momentum.
| Employee | Program progress | Payroll | Accounts payable | Revenue |
|---|---|---|---|---|
| Jane Smith | 84% | Strong | Strong | Developing |
| John Adams | 68% | Developing | Strong | In progress |
| Maria Lopez | 92% | Strong | Developing | Strong |
| Daniel Chen | 51% | Not assessed | Developing | Needs attention |
Readiness, completed programs, strong skills, gaps, and qualified top performers in one view.
Compare program progress and demonstrated skill status person by person.
Strong, Developing, Needs attention, In progress, and Not assessed each have a clear meaning.
Product walkthrough
See the learner experience and the manager view—from hands-on work to clearer team decisions.
The learner experience
Learners do more than watch lessons. They work through realistic accounting tasks inside Controller Lab — using source documents, reconciliations, journal entries, browser-based workbooks, and graded submissions.
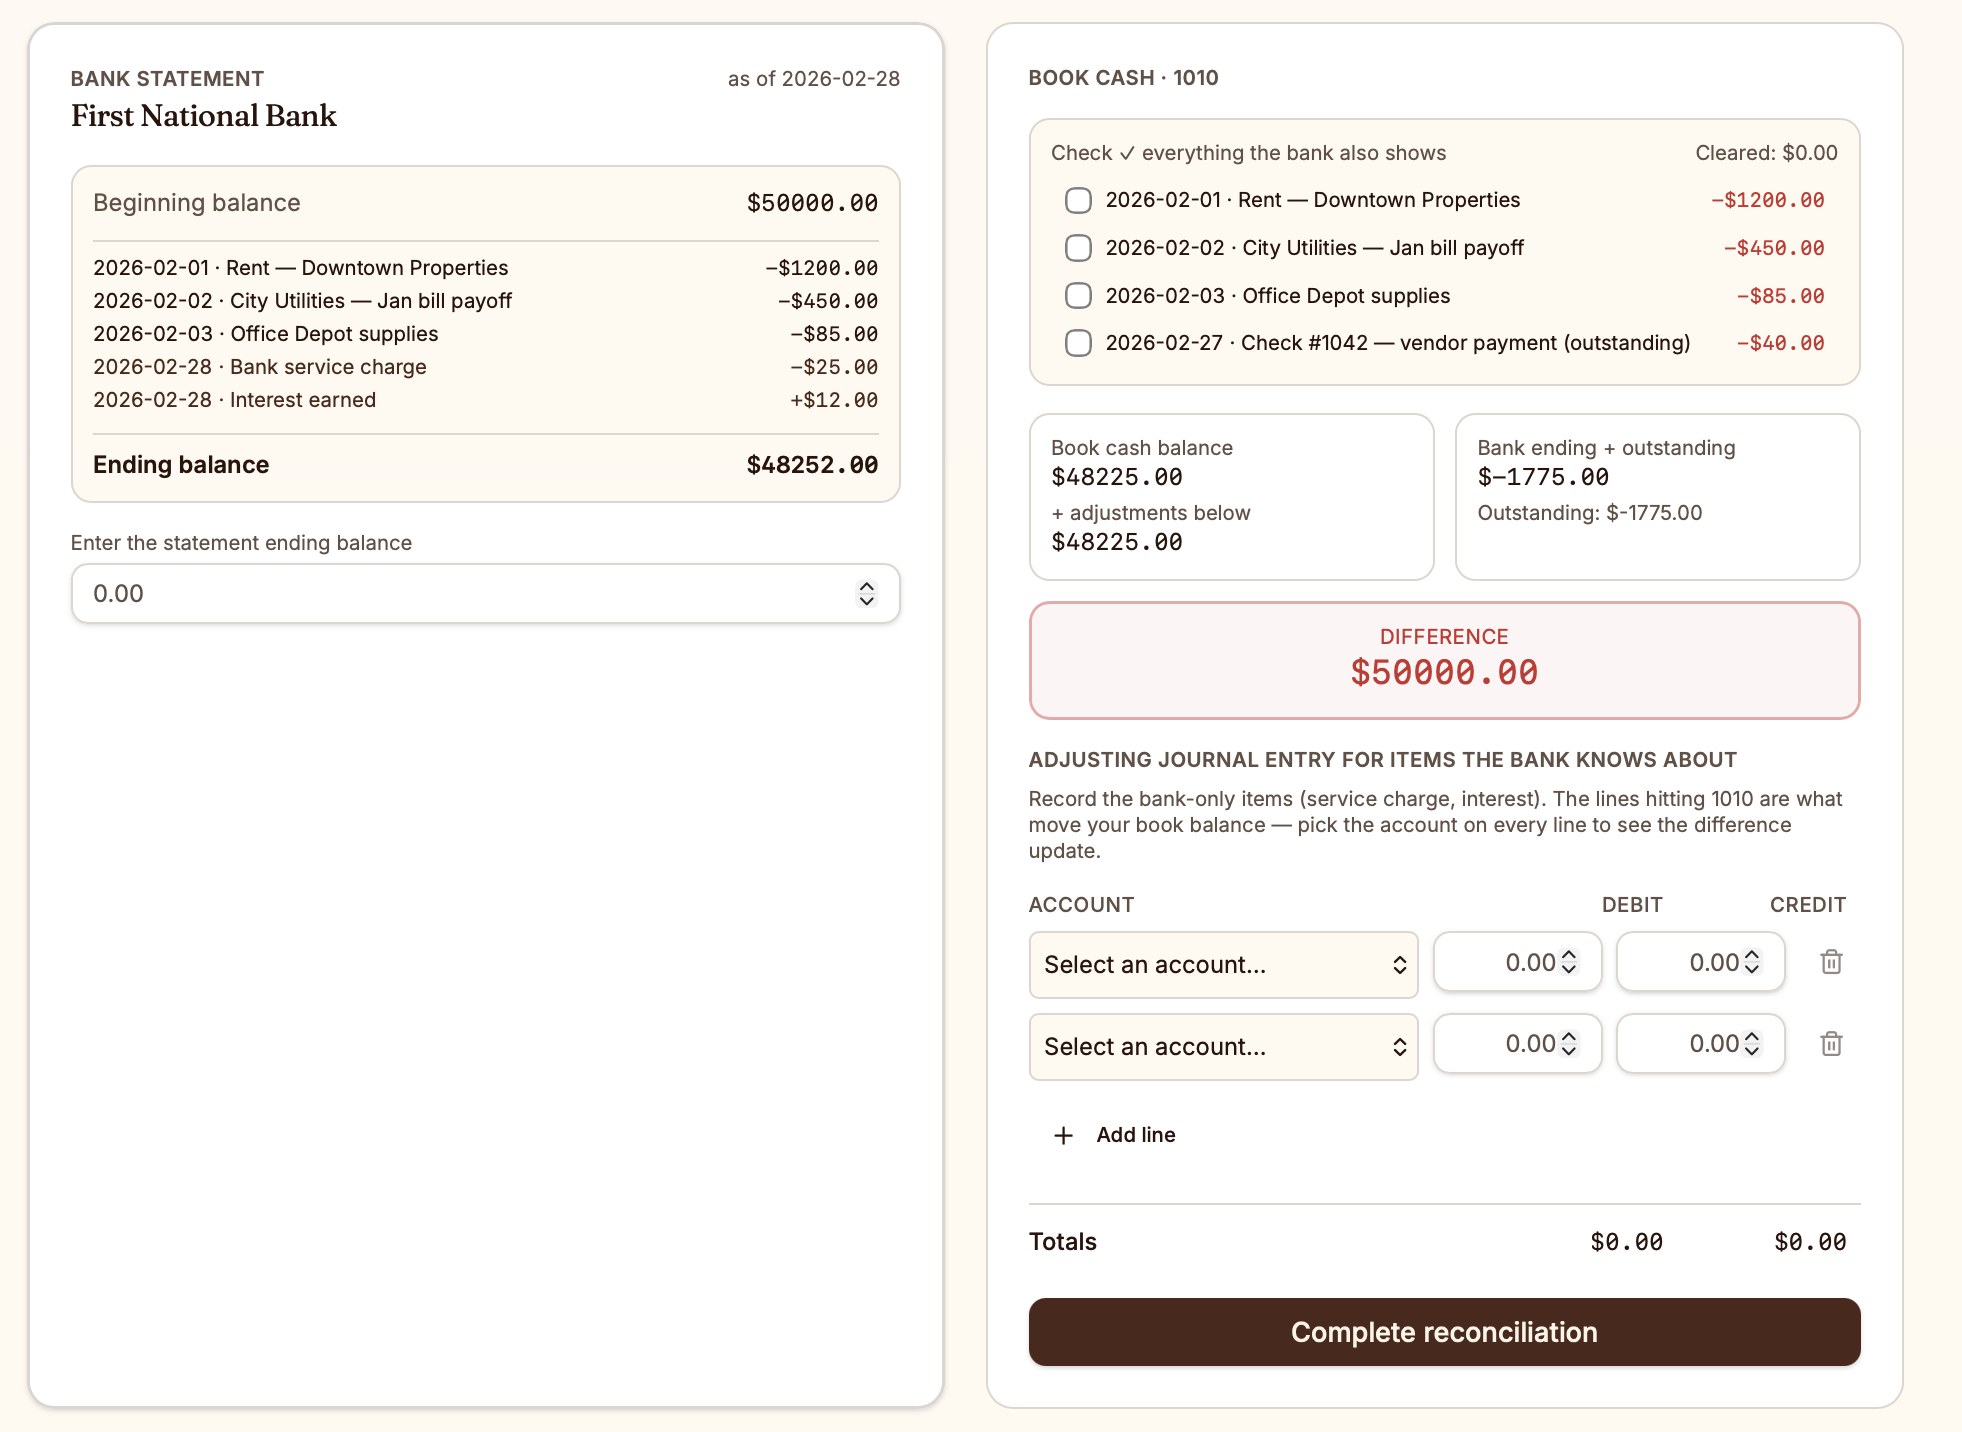
Reconcile book cash to the bank statement and record the required adjustments.
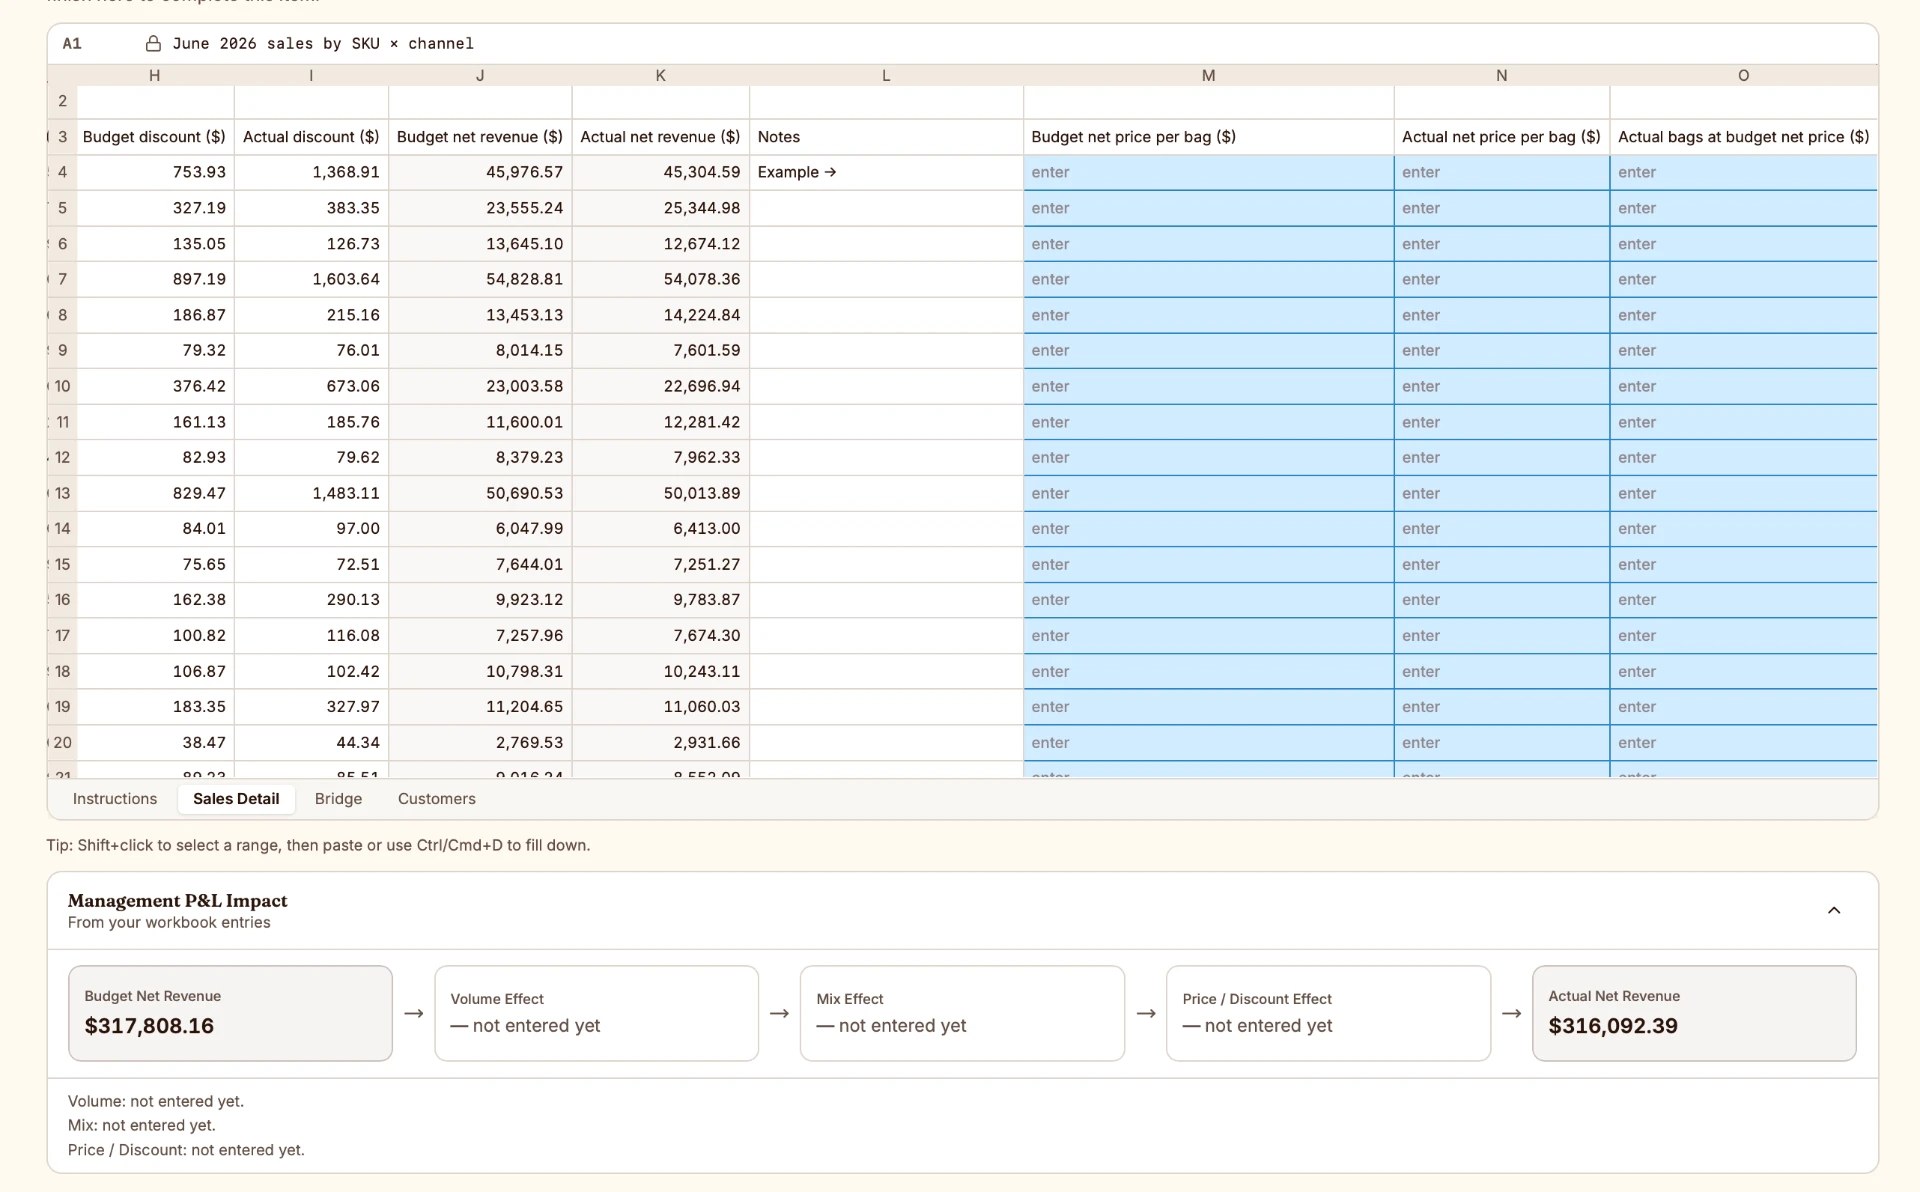
Work through real operating data and see how the analysis affects management reporting.
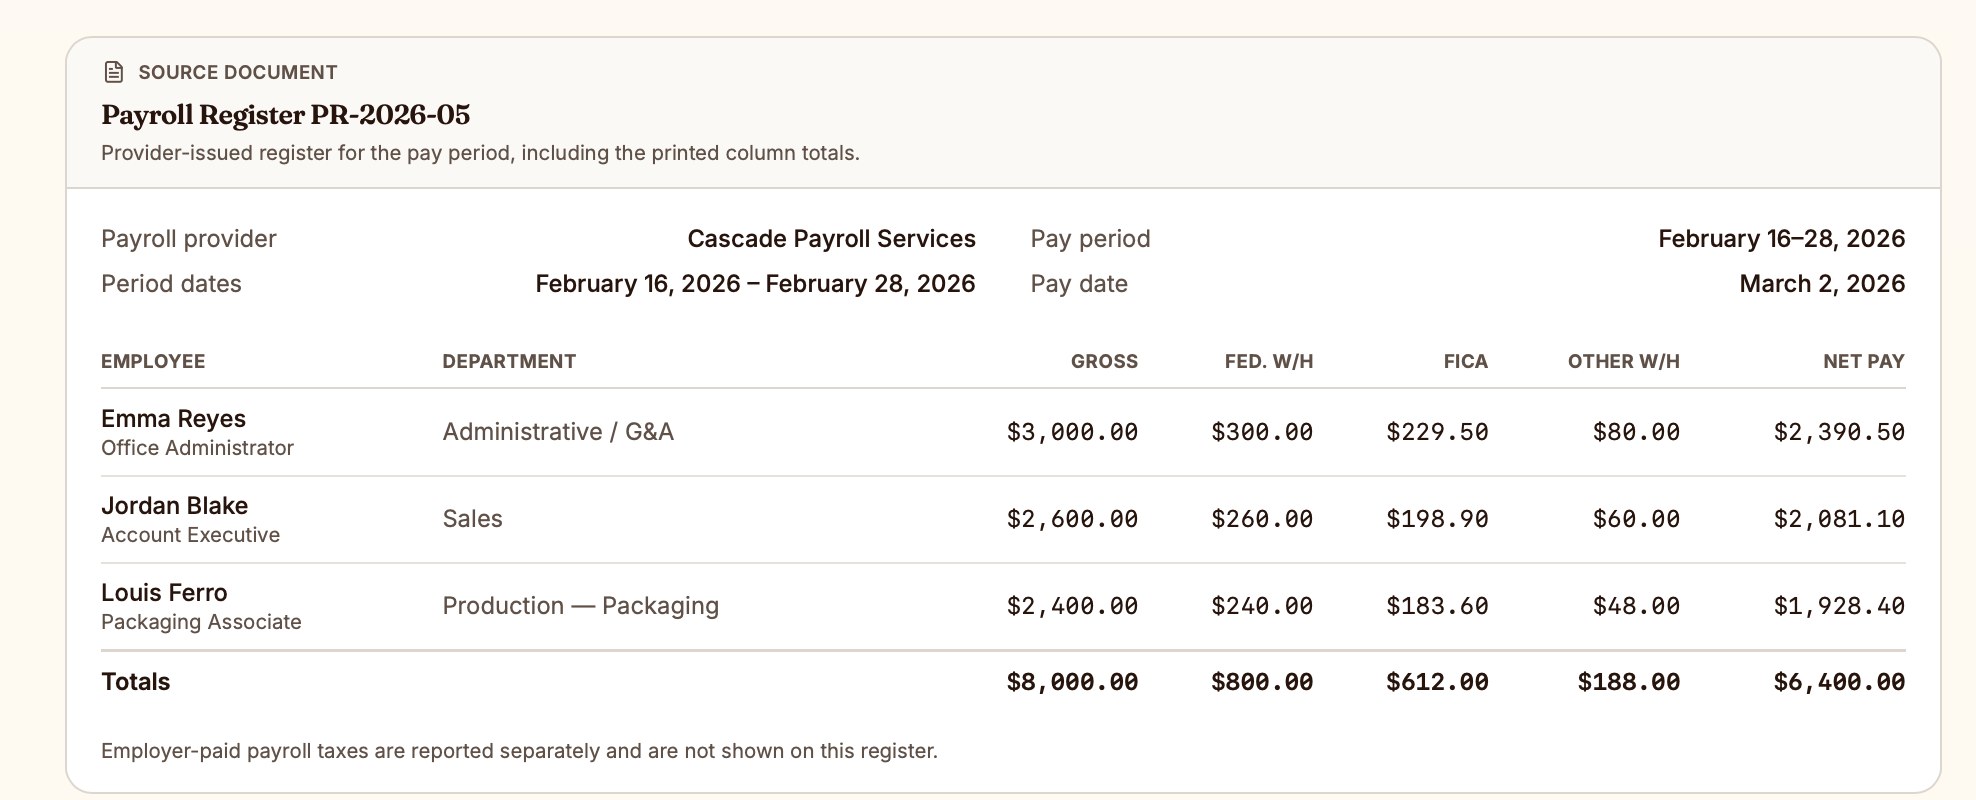
Use payroll source documents to prepare and submit accurate journal entries.
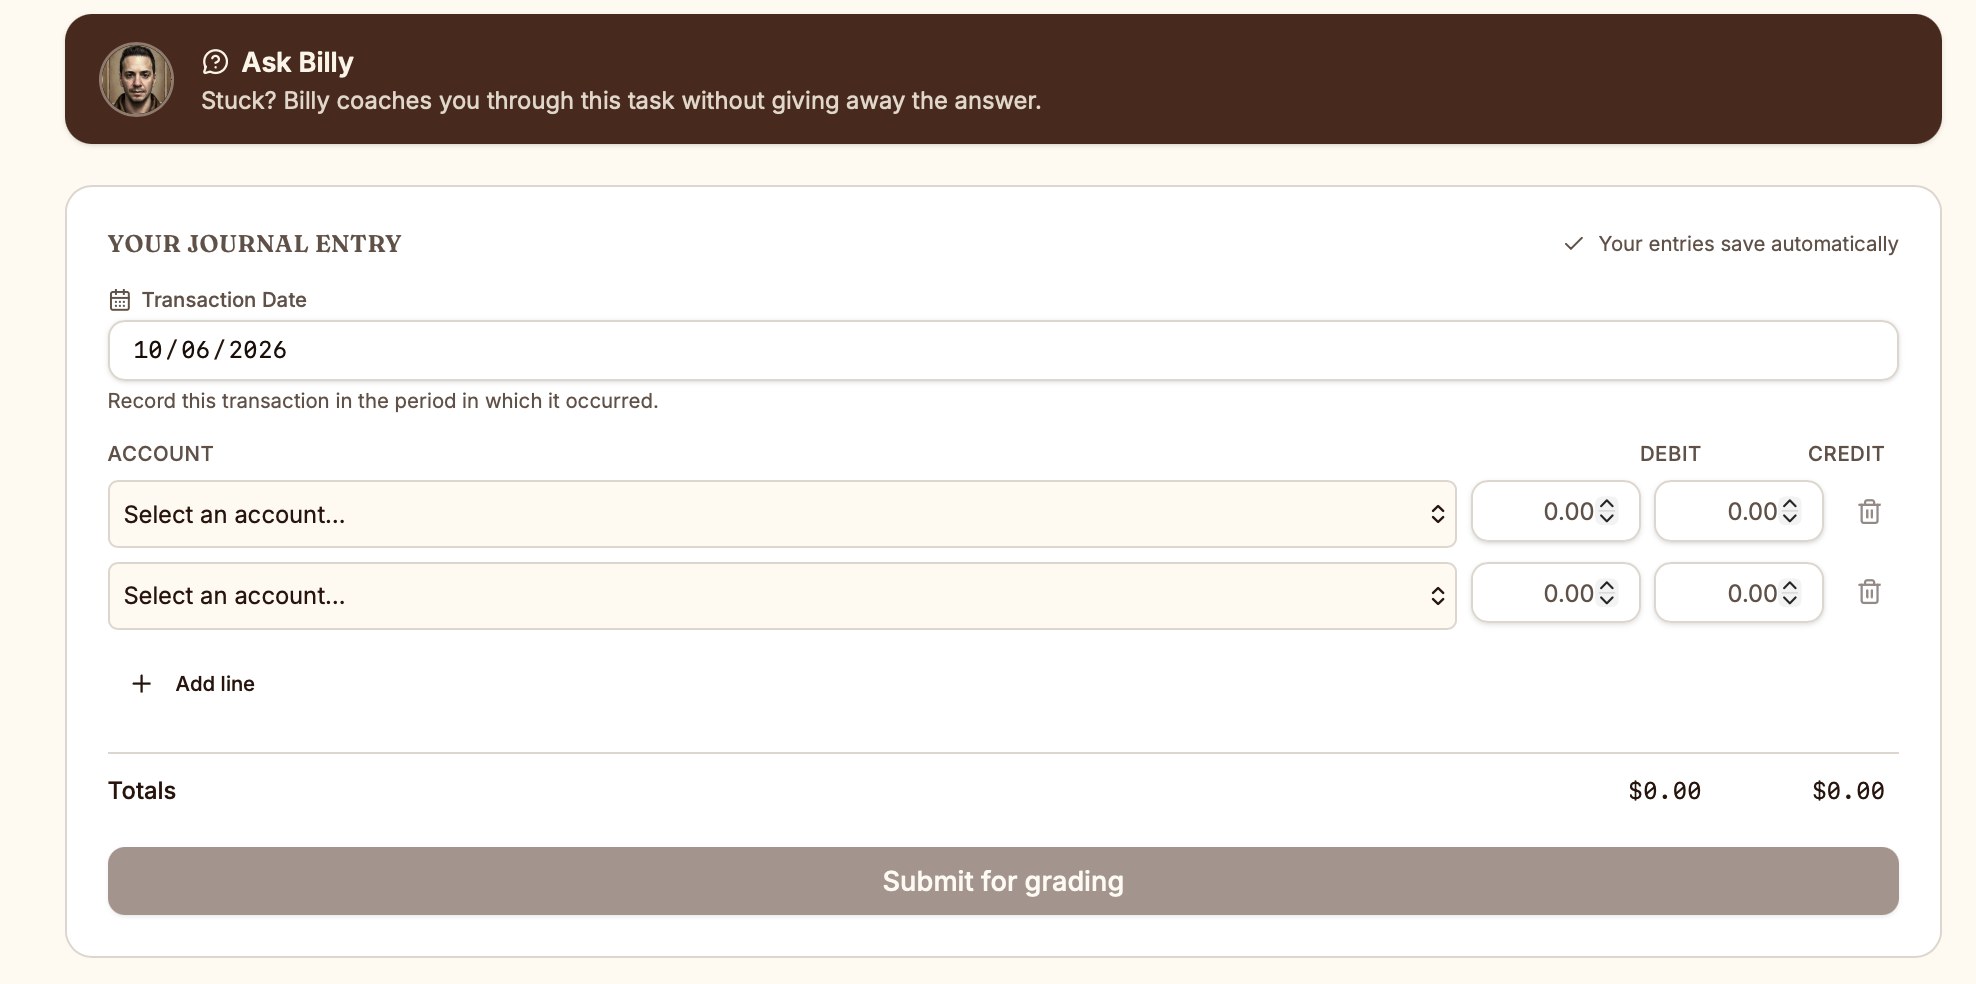
Learners complete the work themselves, with coaching and grading built into the task.
Why teams choose Controller Lab
Course completion tells you who reached the end. Controller Lab shows what each person demonstrated along the way.
Learners work through realistic close, reporting, payroll, AP, AR, revenue, GL, and inventory scenarios.
Skill ratings come from completed graded work, while program progress remains a separate measure.
See who is strong in Payroll before assigning payroll work—and where focused coaching is needed.
Assign programs, organize people, monitor progress, and build a repeatable development system.
Recognize real evidence
A focused view of qualified leaders—not a public ranking of every employee.
Fictional team · Payroll example
8 completed graded tasks · 91% average best score
View evidenceImproved 12 points across comparable 14-day periods
View evidenceLatest 3 graded tasks average 88%
View evidenceTop talent by skill
Find qualified leaders without turning the whole team into a public leaderboard. See your Payroll standout, AP rising star, cross-trained talent, and people ready for more responsibility.
Maria Lopez
Payroll
91%
John Adams
Accounts payable
+12 pts
Jane Smith
Revenue
88%
Manager insights
Rule-based observations surface strengths, skill gaps, cross-training, and areas not yet assessed. Managers get a clear next step—not a black-box score.
Maria is the strongest Manufacturing learner at 91%.
Daniel needs attention in Revenue analysis.
Jane is building assessed skills across Manufacturing and SaaS.
Inventory has not yet been assessed for two learners.
Industry readiness
Compare demonstrated performance across Manufacturing and SaaS today, with room to expand as new programs and industries are added. Make staffing, client assignment, and development decisions with better evidence.
Payroll
Inventory
Revenue
Accounts payable
Team momentum
Track completed graded work and average performance week by week. Know whether development is moving—or whether the team needs time, support, or a clearer assignment.
Built for the work
Professional development that supports CPE
Eligible programs are designed to meet applicable CPE requirements, with structured learning, assessments, and completion records. Certificates and CPE tracking are available where designated; not every activity automatically earns CPE credit.
Controller Academy LLC · Sponsor No. 170023
The full NASBA sponsor disclosure appears below.
Simple annual platform pricing
Choose the annual platform tier that fits your workforce. Training credits are purchased separately based on the programs your team needs.
1–5 users
$750
per year
6–10 users
$1,250
per year
11–25 users
$2,000
per year
26–100 users
$4,000
per year
101+ users
Enterprise
custom pricing
1–100 users: create your account, set up your company, then activate your annual plan from the workspace.